Research Roundup
Overlap between ultra-processed food and food that is high in fat, salt or sugar: analysis of 11 annual waves of the UK National Diet and Nutrition Survey 2008/09-2018/19
29 January 2025
This study (1) investigates the overlap between ultra-processed foods (UPFs) and foods high in fat, salt, or sugar (HFSS) in the UK. Its goal is to quantify the proportion of food and drink items consumed in the UK that fall into the categories of HFSS, UPF, both, or neither. Additionally, it aims to identify which food groups contribute most significantly to each category.
Data for the study comes from the National Diet and Nutrition Survey (NDNS), which collected information over 11 years (2008/09 – 2018/19). The NDNS is a continuous cross-sectional survey that gathers data on food consumption, nutrient intake, and the nutritional status of the general UK population. Participants self-reported their food and beverage consumption over three or four days using a written food diary. Foods were classified as HFSS based on the UK Nutrient Profiling Model (NPM) from 2004/05 and, in a sensitivity analysis, using the 2018 NPM. UPFs were classified according to the Nova framework.
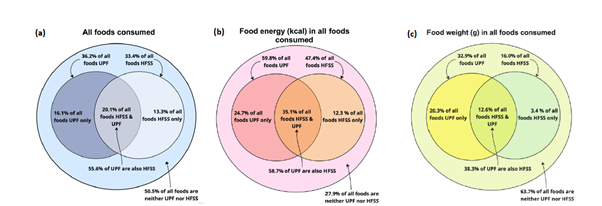
The study found that 33.4% of food items, 47.4% of energy intake, and 16.0% of food weight were HFSS. In comparison, 36.2%, 59.8%, and 32.9% respectively were classified as UPFs. Additionally, 20.1% of foods, 35.1% of energy, and 12.6% of food weight fell into both HFSS and UPF categories, while 50.5%, 27.9%, and 63.7% were neither. Notably, 55.6% of UPF foods, 58.7% of energy from UPFs, and 38.3% of food weight from UPFs consumed were also identified as HFSS. The most common food groups contributing to UPF foods that were not classified as HFSS included low-calorie soft drinks and white bread. See Figure 1.
The study highlights that the UK NPM captures just over half of the UPFs consumed in the country. The authors suggest that by expanding the NPM to include common ingredients found in UPFs, such as non-nutritive sweeteners, this could increase the percentage of UPFs captured and encourage the reformulation of these products.
The study indicates that current UK policies, which emphasise HFSS foods, capture only about half of UPFs. Common items that are UPFs but not HFSS include low-calorie soft drinks, manufactured breads, and high-fibre breakfast cereals. Additionally, many food groups contribute significantly to the various categories of HFSS only, UPF only, both, and neither. For example, the “miscellaneous” food group ranks among the top contributors across many categories, indicating that not all foods within major groups share the same UPF or HFSS status.
The strengths of this study include the use of detailed dietary data from food diaries per participant sourced from the NDNS, which helps to reduce recall bias commonly found in other dietary assessment methods. The study also evaluates three metrics of food consumption: total number of foods, food energy, and food weight. However, limitations exist including the reliance on self-reported data from food diaries, which can lead to inaccuracies in recalling portion sizes and types of foods consumed, as well as recall bias. Additionally, the use of outdated data—the most recent being from 2019—limits the findings’ relevance given the rapid changes in food availability and consumption patterns. Moreover, combining 11 years of data could obscure important trends over time, although this approach does ensure a larger sample size.
While this research offers insights into the interplay between UPFs and HFSS foods in the UK, fundamental gaps exist in the Nova classification system and the mechanisms for affecting health (outside of current nutrition understanding).
Figure 1. The percentage of (a) all foods, (b) food energy in kcal, and (c) food weight in grams consumed that was derived from foods that are high in fat, salt or sugar, ultra-processed foods, both or neither; UK National Diet and Nutrition Survey 2008/9-2018
Note. HFSS = high in fat, salt or sugar (using the 2004/05 Nutrient Profiling Model); UPF = ultra-processed food
Reference
- Kesaite V, Chavez-Ugalde Y, White M, Adams J. Overlap between ultra-processed food and food that is high in fat, salt or sugar: analysis of 11 annual waves of the UK National Diet and Nutrition Survey 2008/09-2018/19 medRxiv 2024.08.27.24312650 https://doi.org/10.1101/2024.08.27.24312650